Data Visualization and Research
Data Visualizations
Research
This page describes the Linkage to HIV Medical Care indicator data which informs the EHE AHEAD dashboard.
This data visualization dashboard from the U.S. Department of Health and Human Services provides an interactive snapshot of the road to increased linkage to HIV care.
This machine learning model was developed to identify patients at risk for dropping out of care in an urban HIV care clinic using electronic medical records and geospatial data.
The United States HIV care workforce is shrinking, which could complicate service delivery to people living with HIV (PLWH). This study examined the impact of practice transformations, defined as efficiencies in structures and delivery of care, on demonstration project sites within the Workforce Capacity Building Initiative, a Health Resources and Services Administration (HRSA) Ryan White HIV/AIDS Program Special Projects of National Significance (SPNS).
Several studies have shown different effects of telehealth interventions on adherence to Antiretroviral therapy (ART) among people living with HIV. This study conducted a meta-analysis of Randomized Controlled Trials (RCTs) to estimate the pooled effect of telehealth interventions on the treatment adherence of HIV patients.
Data storytelling is a powerful technique that uses narratives and visuals to communicate important data insights. From sharing program successes to applying for funding opportunities, how you talk about your program outcomes can make a world of difference.
“Office Hours” is a technical assistance platform that allows Ryan White HIV/AIDS Program (RWHAP) recipient and provider staff to talk with their peers in an informal setting about specific technical challenges and solutions. These hour-long calls will include a short presentation by a RWHAP recipient or provider about their data management approach.
Summary review of the 2021 RSR data and highlights of specific areas for focused outreach. The goal of this webinar is to ensure data are not only complete, but also accurately reported to reflect the care being provided.
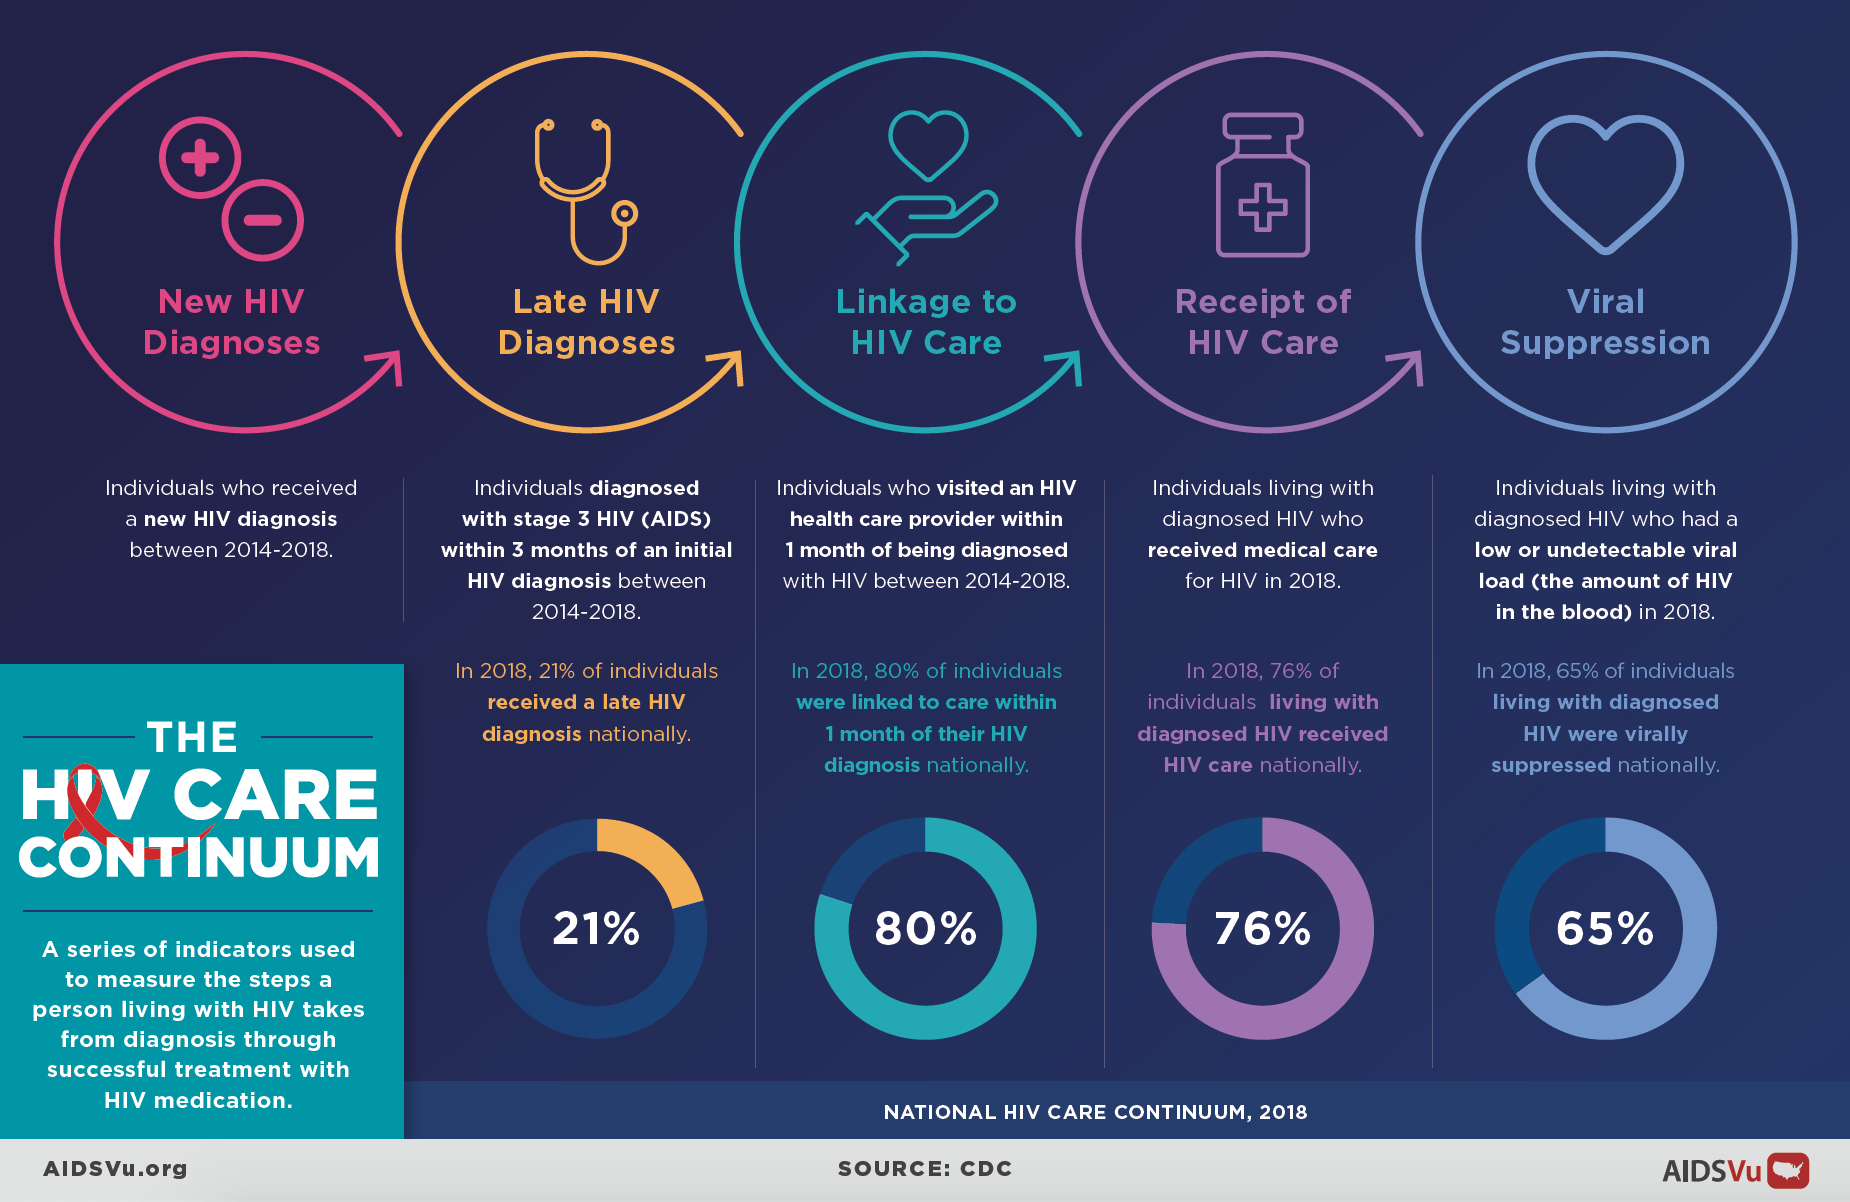
This resource from HIV.gov describes the HIV care continuum, a public health model that outlines the steps or stages that people with HIV go through from diagnosis to achieving and maintaining viral suppression through care and treatment.
It is unknown how the COVID-19 pandemic impacted traditional measures of retention in HIV care. This study calculated six different retention measures at an urban HIV care clinic for two time periods: pre-pandemic, and during the first year of the COVID-19 pandemic, with and without inclusion of telehealth appointments.
Guided by the Exploration, Preparation, Implementation, and Sustainment and Reach, Effectiveness, Adoption, Implementation, and Maintenance frameworks, this study describes the key determinants for CHW integration and sustainability at 3 agencies in Shelby County, TN, to improve viral suppression and reduce disparities among rural and urban people living with HIV.
In this implementation project, an assessment was made of the data capacity of the health system to measure a cascade of care (COC) across HIV, HCV and OUD services in five states to help guide public health planning.


